S&P 500 Index hits all time High
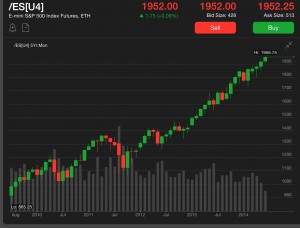
The S&P 500 Index hit its all time high of 1963.16 in the cash market and 1956.75 in the futures market.
For the year the S&P 500 Index is up almost double digits from January 2014.
Friday is the Quadruple Witching day for the S&P Futures and Options. The majority of Options are used to hedge against adverse moves in the markets and the 500 stocks that make up the Index. This Friday the prior month’s futures contract was rolled over to the new forward month. All of the Options expired for the prior month’s futures contract and the requirement is now to reposition Options strategies for the next contract. Volumes will spike and volatility conditions will occur while ETF managers, Mutual Funds and Hedge funds make their positions.
Is this the most under loved rally in history? Based on media headlines, the answer is yes. There should be confetti falling, balloons dropping and hats with Dow 17,000 on the floor of the exchanges.
The move from the March 2009 low to the current record prices are remarkable. Having watched many booms over the past three decades, I would say this is the least liked recovery globally.
One possible explanation for this is the movement of capital to Asian, South American and African markets where double digit returns are the norm, annually. With the slight reversal of returns in emerging markets, the reactions to S&P indexes and Fed stimulus is now a lackluster recovery.
At G20News.com it is Breaking News that the S&P 500 Index hit a record today, Friday June 20th, 2014. Whether we see red boxed Br. News on television or headlines in newspapers Saturday morning is an indicator of its own. Some contra-indicator traders will say that this means that the Bull market is not over, as in when everyone is tooting the horns of Wall Street, one should get bearish. This contra maxim may need to be questioned in the current climate.
Take note of the date, price, Emerging Market prices and media coverage as indicators for future trends.


Comments are closed.